
Page 18 - HUDCO-SHELTER-APR21
P. 18
THEME PAPER
any generated waste, are steel, waste stream after this time is 12.37 tonnes/MW for 1-1.5 MW;
iron, aluminium, copper, dominated by the end-of-life 13.41 tonnes/MW for 1.5-2 MW;
electronic components and blade blades which will become the 12.58 tonnes/MW for more than
material such as glass or carbon biggest problem. 5 MW (Liu and Barlow, 2017).
reinforced plastics and polyvinyl The manufacturing waste is
For India, total waste generated
chloride (PVC) (Andersen et al., by 2050 may be predicted by assumed to be generated in first
2016). Generally, blades and year of installation and taken as
considering all three kinds of
nacelle are likely to be waste i.e. manufacturing, 17.2% of the material installed.
decommissioned after 20-25
service and end-of-life waste. For service waste, the waste is
years (Nijssen and Brøndsted, While end-of-life waste comes assumed to be generated in 6th
2013). These reinforced polymers
from decommissioned blades, (2.9%) and 16th year (5%) of the
are inert in nature and provide the other wastes originate from installation. (Table 1)
the required stability and
manufacturing and maintenance
strength to the structure, but stages. The blades waste The waste produced till 2050 has
since these materials are made been estimated for India (Figure
material may be calculated
from the crossed linked based on the rated power 3). The blade material usage has
thermoset polymers, they cannot been estimated based on the
installed in a particular year. For
be easily degraded in landfills other wastes, estimates may be rated power installed year-wise
(Liu and Barlow, 2017). Even in India since 2002 (IWEA, 2019).
made as a fraction of the total
incinerating these materials may material required for power The power installed in year 2002
result in toxic emissions e.g. has been taken equal to
installed in that year.
dioxins and furans. cumulative power installed till
For determining the blade that time. For years after 2019
Wind energy has evolved as a
material, the blades are (when the data is yet to be
clean source of renewable
categorized into four categories: available), the rate of growth for
energy in the last 30 years with
1 MW, 1–1.5 MW, 1.5–2 MW, cumulative installed capacity
its lesser carbon footprints and
2–5MW and larger than 5 MW. was assumed as 4.9%, average of
minimal pollution and the last two years i.e. 2018 and
Based on experiments
contamination. However, in 2019. This estimation has
performed in other studies, the
terms of life cycle assessment of limitation in terms of
corresponding material may be
wind energy, larger amount of assumptions made for data used
assumed as the following: 8.43
energy is required during in the calculation.
tonnes/MW for less than 1 MW;
manufacturing of these large
blades. Also, much of the energy
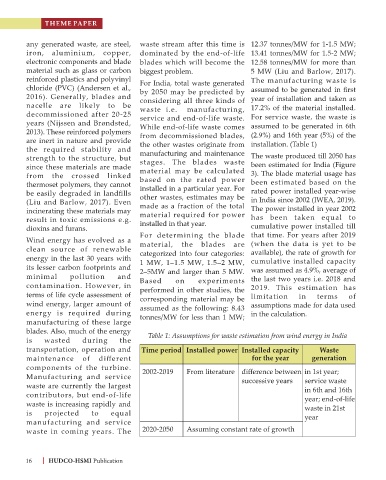
Table 1: Assumptions for waste estimation from wind energy in India
is wasted during the
transportation, operation and Time period Installed power Installed capacity Waste
maintenance of different for the year generation
components of the turbine.
2002-2019 From literature difference between in 1st year;
Manufacturing and service
successive years service waste
waste are currently the largest
in 6th and 16th
contributors, but end-of-life
year; end-of-life
waste is increasing rapidly and
waste in 21st
is projected to equal
year
manufacturing and service
waste in coming years. The 2020-2050 Assuming constant rate of growth
16 HUDCO-HSMI Publication