
Page 44 - Shelter, October 2024
P. 44
POLICY REVIEW
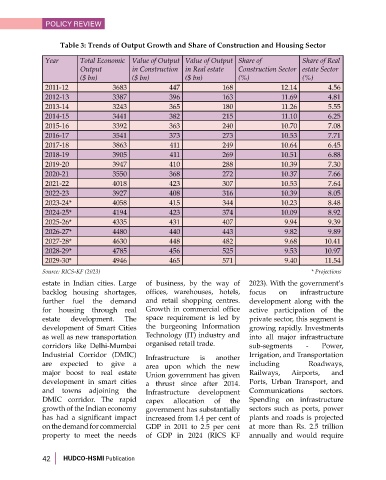
Table 3: Trends of Output Growth and Share of Construction and Housing Sector
Year Total Economic Value of Output Value of Output Share of Share of Real
Output in Construction in Real estate Construction Sector estate Sector
($ bn) ($ bn) ($ bn) (%) (%)
2011-12 3683 447 168 12.14 4.56
2012-13 3387 396 163 11.69 4.81
2013-14 3243 365 180 11.26 5.55
2014-15 3441 382 215 11.10 6.25
2015-16 3392 363 240 10.70 7.08
2016-17 3541 373 273 10.53 7.71
2017-18 3863 411 249 10.64 6.45
2018-19 3905 411 269 10.51 6.88
2019-20 3947 410 288 10.39 7.30
2020-21 3550 368 272 10.37 7.66
2021-22 4018 423 307 10.53 7.64
2022-23 3927 408 316 10.39 8.05
2023-24* 4058 415 344 10.23 8.48
2024-25* 4194 423 374 10.09 8.92
2025-26* 4335 431 407 9.94 9.39
2026-27* 4480 440 443 9.82 9.89
2027-28* 4630 448 482 9.68 10.41
2028-29* 4785 456 525 9.53 10.97
2029-30* 4946 465 571 9.40 11.54
Source: RICS-KF (2023) * Projections
estate in Indian cities. Large of business, by the way of 2023). With the government’s
backlog housing shortages, offices, warehouses, hotels, focus on infrastructure
further fuel the demand and retail shopping centres. development along with the
for housing through real Growth in commercial office active participation of the
estate development. The space requirement is led by private sector, this segment is
development of Smart Cities the burgeoning Information growing rapidly. Investments
as well as new transportation Technology (IT) industry and into all major infrastructure
corridors like Delhi-Mumbai organised retail trade. sub-segments - Power,
Industrial Corridor (DMIC) Infrastructure is another Irrigation, and Transportation
are expected to give a area upon which the new including Roadways,
major boost to real estate Union government has given Railways, Airports, and
development in smart cities a thrust since after 2014. Ports, Urban Transport, and
and towns adjoining the Infrastructure development Communications sectors.
DMIC corridor. The rapid capex allocation of the Spending on infrastructure
growth of the Indian economy government has substantially sectors such as ports, power
has had a significant impact increased from 1.4 per cent of plants and roads is projected
on the demand for commercial GDP in 2011 to 2.5 per cent at more than Rs. 2.5 trillion
property to meet the needs of GDP in 2024 (RICS KF annually and would require
42 HUDCO-HSMI Publication