Page 87 - HUDCO-SHELTER-April22
P. 87

CASE STUDIES


              agricultural plots were sub-    The settlement lies in the      is extracted through bore-
              divided by colonisers into      silty, clay and sandy loam soil   wells  and  the  water  quality
              plots ranging between 41-83     region due to which structures   is  usually  brackish   and
              sq.m. (or 50-100 sq yard) and   built during the 1990’s have    contaminated due to poor
              were sold at Rs.1000/Gaj.       sunk 2-3 feet into the ground.   quality of sewer lines.
              More  than 70  percent  of the   Often  road   construction/
              structures are three storeyed   paving activities results in    GENERAL
              with upper floors rented        buildings to sink further. In   CHARACTERISTICS
              out. Due to its proximity to    order to prevent flooding,      Although     the    surveyed
              Delhi University it caters to   the residents have either       settlements have a diverse
              students as a cheap residential   filled  their  ground  floor  or   character,  there    are
              option. The thriving  rental    constructed retaining walls     commonalities        between
              market     has    encouraged    up to the level of the road.     them in terms of the housing
              construction  activities  while   Sewer lines were constructed   pattern,   typology     and
              the women run a thriving        by the residents from their     infrastructure. A comparative
              business supplying meals to     own resources. Source of        picture of the surveyed
              the students.                   water is groundwater which      settlements  is presented in

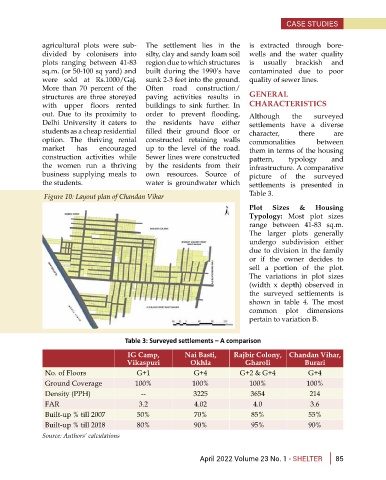
               Figure 10: Layout plan of Chandan Vihar                        Table 3.
                                                                              Plot   Sizes   &    Housing
                                                                              Typology:  Most plot sizes
                                                                              range between  41-83 sq.m.
                                                                              The larger plots generally
                                                                              undergo  subdivision  either
                                                                              due to division in the family
                                                                              or if the owner decides to
                                                                              sell  a portion  of the  plot.
                                                                              The variations in plot sizes
                                                                              (width x depth) observed in
                                                                              the surveyed settlements is
                                                                              shown in table 4. The most
                                                                              common plot dimensions
                                                                              pertain to variation B.


                                       Table 3: Surveyed settlements – A comparison

                                        IG Camp,          Nai Basti,      Rajbir Colony,  Chandan Vihar,
                                        Vikaspuri           Okhla           Gharoli            Burari
               No. of Floors               G+1               G+4           G+2 & G+4            G+4
               Ground Coverage             100%             100%              100%             100%
               Density (PPH)                --               3225             3654              214
               FAR                          3.2              4.02              4.0               3.6
               Built-up % till 2007        50%               70%              85%               55%
               Built-up % till 2018        80%               90%              95%               90%
              Source: Authors’ calculations


                                                               April 2022 Volume 23 No. 1 - SHELTER     85
   82   83   84   85   86   87   88   89   90   91   92