
Page 39 - SHELTER
P. 39
POLICY REVIEW
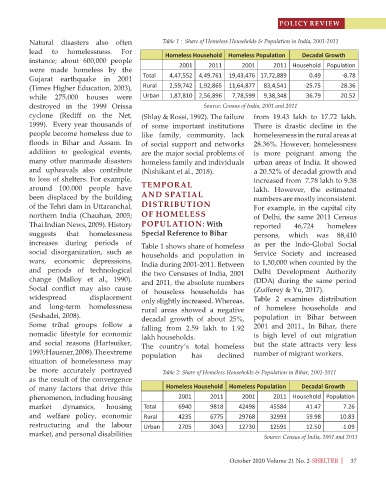
Natural disasters also often Table 1 : Share of Homeless Households & Population in India, 2001-2011
lead to homelessness. For Homeless Household Homeless Population Decadal Growth
instance; about 600,000 people
were made homeless by the 2001 2011 2001 2011 Household Population
Gujarat earthquake in 2001 Total 4,47,552 4,49,761 19,43,476 17,72,889 0.49 -8.78
(Times Higher Education, 2003), Rural 2,59,742 1,92,865 11,64,877 83,4,541 -25.75 -28.36
while 275,000 houses were Urban 1,87,810 2,56,896 7,78,599 9,38,348 36.79 20.52
destroyed in the 1999 Orissa Source: Census of India, 2001 and 2011
cyclone (Rediff on the Net, (Shlay & Rossi, 1992). The failure from 19.43 lakh to 17.72 lakh.
1999). Every year thousands of of some important institutions There is drastic decline in the
people become homeless due to like family, community, lack homelessness in the rural areas at
floods in Bihar and Assam. In of social support and networks 28.36%. However, homelessness
addition to geological events, are the major social problems of is more poignant among the
many other manmade disasters homeless family and individuals urban areas of India. It showed
and upheavals also contribute (Nishikant et al., 2018). a 20.52% of decadal growth and
to loss of shelters. For example, increased from 7.78 lakh to 9.38
around 100,000 people have TEMPORAL lakh. However, the estimated
been displaced by the building AND SPATIAL numbers are mostly inconsistent.
of the Tehri dam in Uttaranchal, DISTRIBUTION For example, in the capital city
northern India (Chauhan, 2005; OF HOMELESS of Delhi, the same 2011 Census
Thai Indian News, 2009). History POPULATION: With reported 46,724 homeless
suggests that homelessness Special Reference to Bihar persons, which was 88,410
increases during periods of Table 1 shows share of homeless as per the Indo-Global Social
social disorganization, such as households and population in Service Society and increased
wars, economic depressions, India during 2001-2011. Between to 1,50,000 when counted by the
and periods of technological the two Censuses of India, 2001 Delhi Development Authority
change (Malloy et al., 1990). and 2011, the absolute numbers (DDA) during the same period
Social conflict may also cause of houseless households has (Zufferey & Yu, 2017).
widespread displacement only slightly increased. Whereas, Table 2 examines distribution
and long-term homelessness rural areas showed a negative of homeless households and
(Seshadri, 2008). decadal growth of about 25%, population in Bihar between
Some tribal groups follow a falling from 2.59 lakh to 1.92 2001 and 2011., In Bihar, there
nomadic lifestyle for economic lakh households. is high level of out migration
and social reasons (Hartsuiker, The country’s total homeless but the state attracts very less
1993; Hausner, 2008). The extreme population has declined number of migrant workers.
situation of homelessness may
be more accurately portrayed Table 2: Share of Homeless Households & Population in Bihar, 2001-2011
as the result of the convergence
of many factors that drive this Homeless Household Homeless Population Decadal Growth
phenomenon, including housing 2001 2011 2001 2011 Household Population
market dynamics, housing Total 6940 9818 42498 45584 41.47 7.26
and welfare policy, economic Rural 4235 6775 29768 32993 59.98 10.83
restructuring and the labour Urban 2705 3043 12730 12591 12.50 -1.09
market, and personal disabilities Source: Census of India, 2001 and 2011
October 2020 Volume 21 No. 2-SHELTER 37