
Page 40 - SHELTER
P. 40
POLICY REVIEW
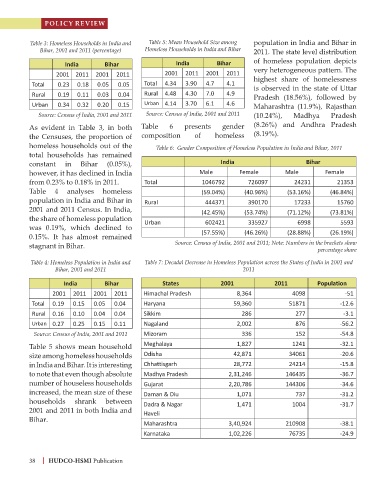
Table 3: Homeless Households in India and Table 5: Mean Household Size among population in India and Bihar in
Bihar, 2001 and 2011 (percentage) Homeless Households in India and Bihar 2011. The state level distribution
India Bihar India Bihar of homeless population depicts
2001 2011 2001 2011 2001 2011 2001 2011 very heterogeneous pattern. The
highest share of homelessness
Total 0.23 0.18 0.05 0.05 Total 4.34 3.90 4.7 4.1 is observed in the state of Uttar
Rural 0.19 0.11 0.03 0.04 Rural 4.48 4.30 7.0 4.9 Pradesh (18.56%), followed by
Urban 0.34 0.32 0.20 0.15 Urban 4.14 3.70 6.1 4.6 Maharashtra (11.9%), Rajasthan
Source: Census of India, 2001 and 2011 Source: Census of India, 2001 and 2011 (10.24%), Madhya Pradesh
As evident in Table 3, in both Table 6 presents gender (8.26%) and Andhra Pradesh
the Censuses, the proportion of composition of homeless (8.19%).
homeless households out of the Table 6: Gender Composition of Homeless Population in India and Bihar, 2011
total households has remained
constant in Bihar (0.05%), India Bihar
however, it has declined in India Male Female Male Female
from 0.23% to 0.18% in 2011. Total 1046792 726097 24231 21353
Table 4 analyses homeless (59.04%) (40.96%) (53.16%) (46.84%)
population in India and Bihar in Rural 444371 390170 17233 15760
2001 and 2011 Census. In India, (42.45%) (53.74%) (71.12%) (73.81%)
the share of homeless population Urban 602421 335927 6998 5593
was 0.19%, which declined to
0.15%. It has almost remained (57.55%) (46.26%) (28.88%) (26.19%)
stagnant in Bihar. Source: Census of India, 2001 and 2011; Note: Numbers in the brackets show
percentage share
Table 4: Homeless Population in India and Table 7: Decadal Decrease in Homeless Population across the States of India in 2001 and
Bihar, 2001 and 2011 2011
India Bihar States 2001 2011 Population
2001 2011 2001 2011 Himachal Pradesh 8,364 4098 -51
Total 0.19 0.15 0.05 0.04 Haryana 59,360 51871 -12.6
Rural 0.16 0.10 0.04 0.04 Sikkim 286 277 -3.1
Urban 0.27 0.25 0.15 0.11 Nagaland 2,002 876 -56.2
Source: Census of India, 2001 and 2011 Mizoram 336 152 -54.8
Table 5 shows mean household Meghalaya 1,827 1241 -32.1
size among homeless households Odisha 42,871 34061 -20.6
in India and Bihar. It is interesting Chhattisgarh 28,772 24214 -15.8
to note that even though absolute Madhya Pradesh 2,31,246 146435 -36.7
number of houseless households Gujarat 2,20,786 144306 -34.6
increased, the mean size of these Daman & Diu 1,071 737 -31.2
households shrank between Dadra & Nagar 1,471 1004 -31.7
2001 and 2011 in both India and Haveli
Bihar.
Maharashtra 3,40,924 210908 -38.1
Karnataka 1,02,226 76735 -24.9
38 HUDCO-HSMI Publication