
Page 47 - Shelter-October-2022
P. 47
POLICY REVIEW
as per 2011 census) and tool which showcases the scenario (SSP2-4.5).
Mumbai (population 12.48 impact of sea level rise along
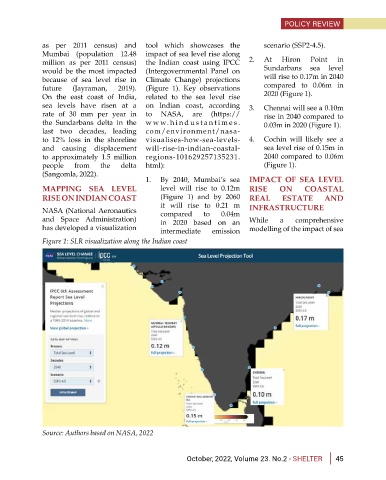
million as per 2011 census) the Indian coast using IPCC 2. At Hiron Point in
would be the most impacted (Intergovernmental Panel on Sundarbans sea level
because of sea level rise in Climate Change) projections will rise to 0.17m in 2040
future (Jayraman, 2019). (Figure 1). Key observations compared to 0.06m in
On the east coast of India, related to the sea level rise 2020 (Figure 1).
sea levels have risen at a on Indian coast, according 3. Chennai will see a 0.10m
rate of 30 mm per year in to NASA, are (https:// rise in 2040 compared to
the Sundarbans delta in the w ww.h i nd u st a nt i me s . 0.03m in 2020 (Figure 1).
last two decades, leading com/environment/nasa-
to 12% loss in the shoreline visualises-how-sea-levels- 4. Cochin will likely see a
and causing displacement will-rise-in-indian-coastal- sea level rise of 0.15m in
to approximately 1.5 million regions-101629257135231. 2040 compared to 0.06m
people from the delta html): (Figure 1).
(Sangomla, 2022).
1. By 2040, Mumbai’s sea IMPACT OF SEA LEVEL
MAPPING SEA LEVEL level will rise to 0.12m RISE ON COASTAL
RISE ON INDIAN COAST (Figure 1) and by 2060 REAL ESTATE AND
it will rise to 0.21 m
NASA (National Aeronautics compared to 0.04m INFRASTRUCTURE
and Space Administration) in 2020 based on an While a comprehensive
has developed a visualization intermediate emission modelling of the impact of sea
Figure 1: SLR visualization along the Indian coast
Source: Authors based on NASA, 2022
October, 2022, Volume 23. No.2 - SHELTER 45