Page 29 - HUDCO-SHELTER-April22
P. 29

THEME PAPER


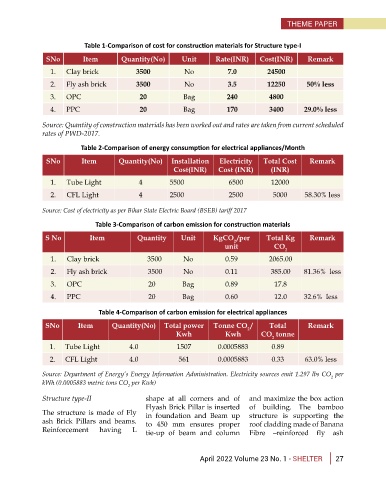
                           Table 1-Comparison of cost for construction materials for Structure type-I
               SNo         Item       Quantity(No)       Unit      Rate(INR)     Cost(INR)      Remark

                 1.  Clay brick            3500           No           7.0         24500
                 2.  Fly ash brick         3500           No           3.5         12250       50% less

                 3.  OPC                    20           Bag           240          4800
                 4.  PPC                    20           Bag           170          3400       29.0% less

              Source: Quantity of construction materials has been worked out and rates are taken from current scheduled
              rates of PWD-2017.
                          Table 2-Comparison of energy consumption for electrical appliances/Month

               SNo        Item        Quantity(No)    Installation   Electricity  Total Cost    Remark
                                                      Cost(INR)     Cost (INR)      (INR)
                 1.   Tube Light            4        5500              6500         12000
                 2.   CFL Light             4        2500              2500          5000      58.30% less


              Source: Cost of electricity as per Bihar State Electric Board (BSEB) tariff 2017
                              Table 3-Comparison of carbon emission for construction materials

               S No          Item          Quantity      Unit      KgCO /per       Total Kg     Remark
                                                                         2
                                                                      unit           CO
                                                                                         2
                 1.   Clay brick                3500     No           0.59          2065.00
                 2.   Fly ash brick            3500      No           0.11          385.00     81.36%  less

                 3.   OPC                      20        Bag          0.89           17.8
                 4.   PPC                      20        Bag          0.60           12.0      32.6%  less

                               Table 4-Comparison of carbon emission for electrical appliances

               SNo       Item      Quantity(No)     Total power    Tonne CO /       Total       Remark
                                                                             2
                                                       Kwh            Kwh        CO  tonne
                                                                                     2
                1.   Tube Light          4.0           1507         0.0005883        0.89
                2.   CFL Light           4.0            561         0.0005883        0.33      63.0% less

              Source: Department of Energy’s Energy Information Administration. Electricity sources emit 1.297 lbs CO  per
                                                                                                       2
              kWh (0.0005883 metric tons CO  per Kwh)
                                        2
              Structure type-II               shape at all corners and of     and maximize the box action
                                              Flyash Brick Pillar is inserted   of building. The bamboo
              The structure is made of Fly    in foundation and Beam up       structure is supporting the
              ash Brick Pillars and beams.    to 450 mm ensures proper        roof cladding made of Banana
              Reinforcement     having    L   tie-up of beam and column       Fibre  –reinforced  fly  ash


                                                               April 2022 Volume 23 No. 1 - SHELTER     27
   24   25   26   27   28   29   30   31   32   33   34